
Week 1 Reflection
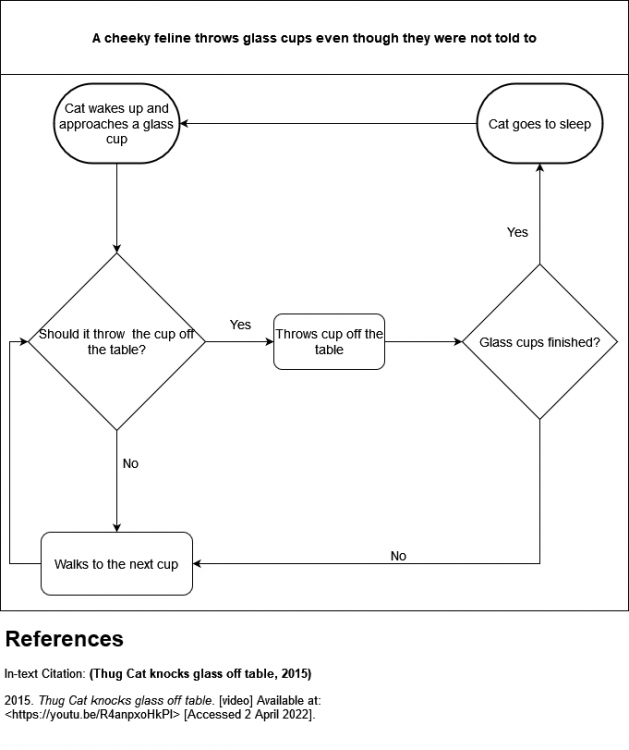
I decided to showcase the work in a form of flowcharts and mindmaps. I wanted to initially make a simple storyboard or a small video but because of poor time management due to long planning, and that drawings charts were the first thing that came to my mind. I created a flow chart for my first premise (as shown below in Fig.1). It shows what the cat does daily, which is throwing glass cups off the shelves or table. I showcased this premise in a form of a flowchart as the decision that I have seen a cat does is usually linear or has a set path on what the actions are.
For this week’s work, I created charts (flowcharts and mindmaps) of my work when exploring the idea of “why do we tell stories?” I tackled two premises for that week which were “A cheeky feline throws glass cups even though they were not told to.” and “Mobile phones ordering us what to do. Even though it should be the other way around.”
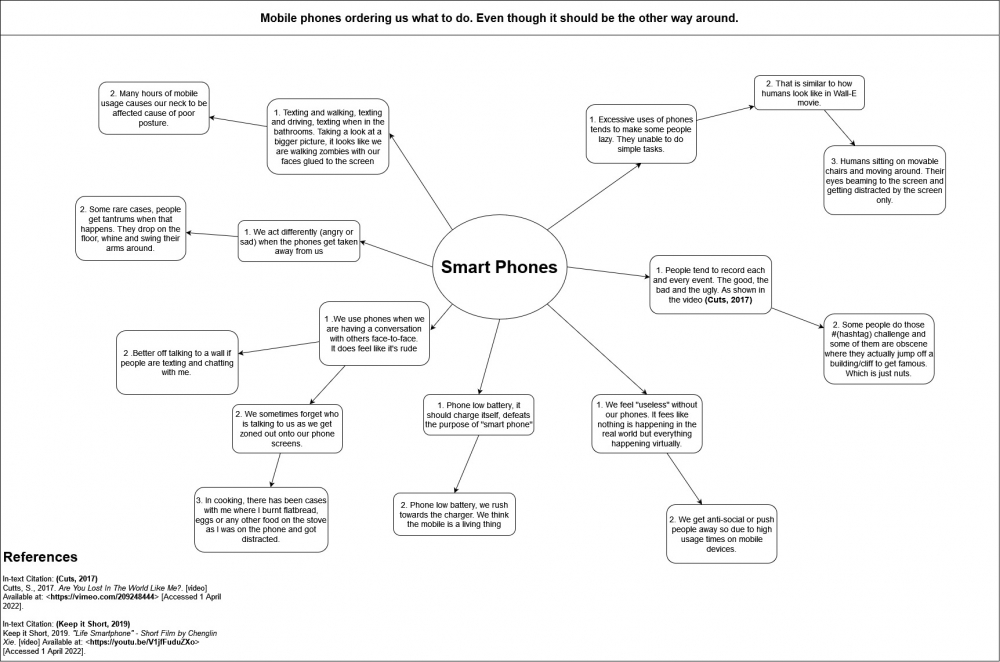
Then I had to do a mindmap for the second premise as the flowchart was not enough. Since there wasn’t enough information in Fig.1 chart, it felt empty and more could be added. So I thought of another premise and made a mindmap out of it (as shown in Fig.2 below). On this mindmap, I described how a smartphone is affecting us in our day-to-day life. I chose a mindmap as I can break down the ideas into smaller ideas and link them together with a branch, stating that they are related to the previous idea. I can branch out as far I want, hence with mindmaps, I can write down as many details as I want.
For Fig.1 I used this video (Thug Cat knocks glass off table, 2015) as a quick reference I found on Youtube. I have heard stories from other friends that their cat just throws random objects off tables or shelves so I mostly based the flowchart on that. As for Fig.2, I watched two videos, (Cuts, 2017) and (Keep it Short, 2019) and both of them are 2D Animations. I would highly recommend watching the animation video by Steve Cutts as that is a relatable video to this day.
Looking through the videos cited above, gave me the awareness of how intensive mobile usage users get affected mentally, and physically and also affect the people around them. Plus, it gave me a visually better and more detailed mindmap compared to the less detailed flowchart
Week 1 References
- Cutts, S., 2017. Are You Lost In The World Like Me?. [video] Available at: <https://vimeo.com/209248444> [Accessed 1 April 2022].
- Keep it Short, 2019. "Life Smartphone" - Short Film by Chenglin Xie. [video] Available at: <https://youtu.be/V1jfFuduZXo> [Accessed 1 April 2022].
- 2015. Thug Cat knocks glass off table. [video] Available at: <https://youtu.be/R4anpxoHkPI> [Accessed 2 April 2022].
About This Work
By Khatim Javed Dar
Email Khatim Javed Dar
Published On: 05/04/2022
mediums:
scopes:
tags:
#Animated Narratives Week 1, chart, flowchart, illustration, cat, smart phones